Join smart, curious folks to get the Data Ops 📊 newsletter each week (it’s free!)

This is the 48th essay I’ve written this year. How am I doing?
At the beginning of the year my goals were:
-
write 2x/week (GOAL: missed this slightly ambitious goal, which probably needed to be revised. I did write 48 posts, +77% over last year)
-
exceed 500 free subscribers (GOAL: missed this one as well. Maybe you’ll help me out with that, though subscriber growth has been steady, so … THANKS!)
I am happy about the output. Writing almost once a week and keeping it up for over a year feels like a win. The message is that continuing the habit of writing creates value over time.
Today, I analyzed the past 47 posts to find enduring topics. There were a few buckets that keep showing up across the writing from this year.
Process and Product
Process is the description of how you do things, preferably in a way others easily understand. Repeatable process is one way you get an improvement over time. Repetition in a process is a core building block in creating a better product: you need to be able to take a similar approach across a wide surface area to have a consistent and coherent product. Product and process appeared in almost 30% of my essays.
This essay is on driving agreement between stakeholders using written product definitions.

Analytics
You can’t have effective process and product without measuring what you’re doing. Building analytics that look backward and forward means that the component pieces need to be aligned to a common denominator. I wrote about analytics about 14% of the time this year – if you include dashboards, it’s close to 20%.
This essay is on making metrics atomic and self-describing.
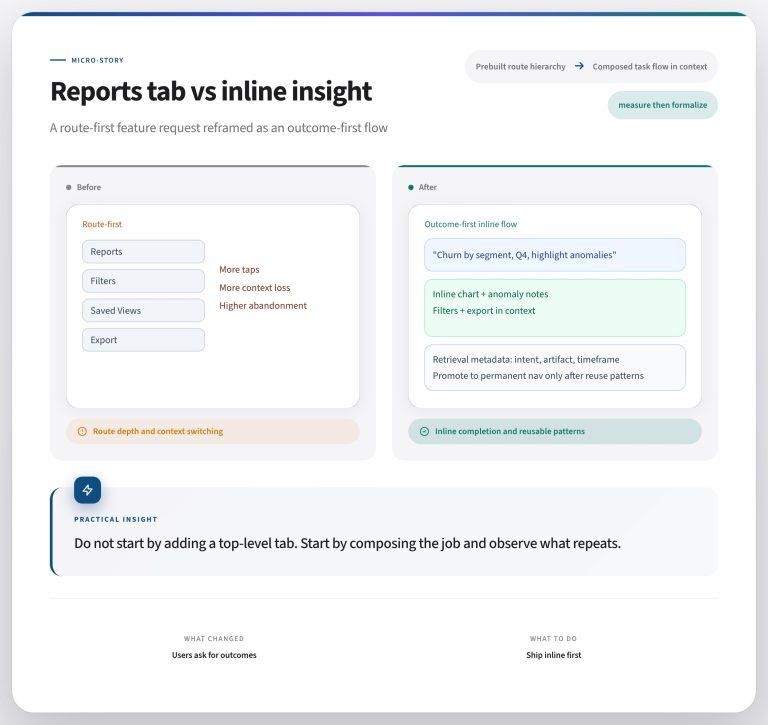
Usability
Determining what to build is a balance between what users say they want, what they actually do, and what they will pay for. Usability is the study of how easy it is for interfaces to be used. Usability appeared in 18% of essays I wrote this year.
This essay covers building features that match or anticipate user behavior.
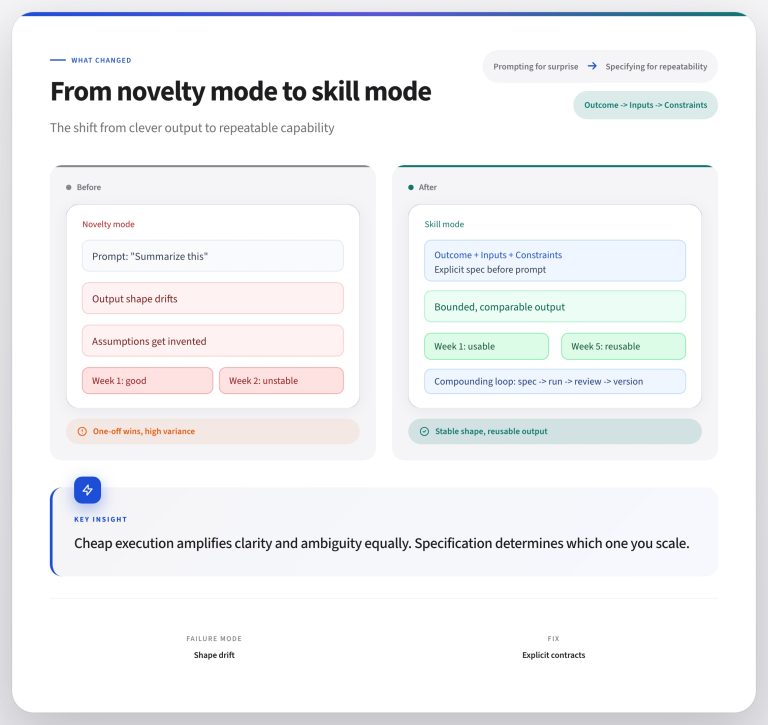
Automation
Doing things automatically is a logical outcome from building a usable, amazing process and measuring whether it gets done. Since machines are good at doing what we tell them to do, why wouldn’t we build ways for them to augment the manual things in our software? Building usable automation to unlock us to do more high value work covered about 8% of the writing I did this year, though a lot more if you count it as generalized process.
This essay is on creating automation from a well-defined process.
What’s the takeaway? Take some time to review the work you did this year. Even if you missed some of the goals that you set, remember that they were based on what you knew at the time.
A Thread from This Week
A Twitter thread to dive into a topic
Excel and Google Sheets are used by hundreds of millions of people around the world every day. Why has no one built a gaming platform for them yet? Here’s a few ideas: