In the product process, if you’ve been taking requests for a while, you’re used to people asking: “how long will this take to get done.” Another common request is “which feature do we want to build from the backlog?” Unless the process is super clear, the team might not know how “ordinary” requests make it from an idea into the product development process.
First, it’s important to point out that certain requests are exceptions to this rule. Items get escalated due to bugs in your product. Requests get prioritized in the sales process. Some features are so obvious to build that there is almost no debate about whether to do it or not.
But everyone’s got opinions on the items that should be elevated from the backlog into the current list of features to be worked on. (I say “should”) because when they make their suggestion, they don’t usually have a rubric for determining if one feature outranks another one. Being a data nerd (and a spreadsheet nerd), I thought this process would be better if driven through a spreadsheet.
Proposing a feature prioritization model
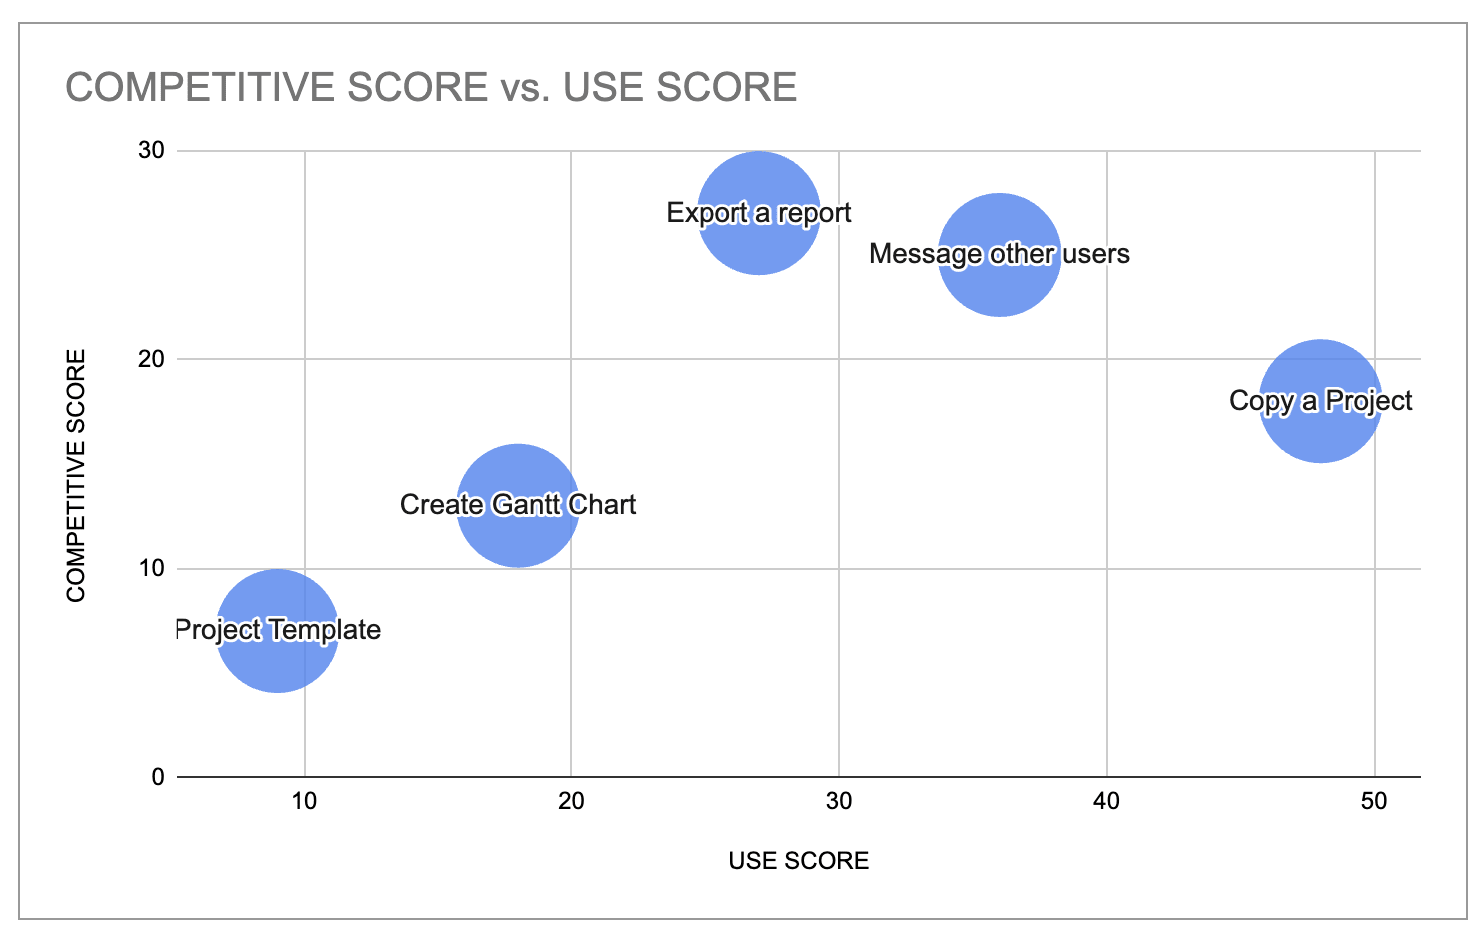
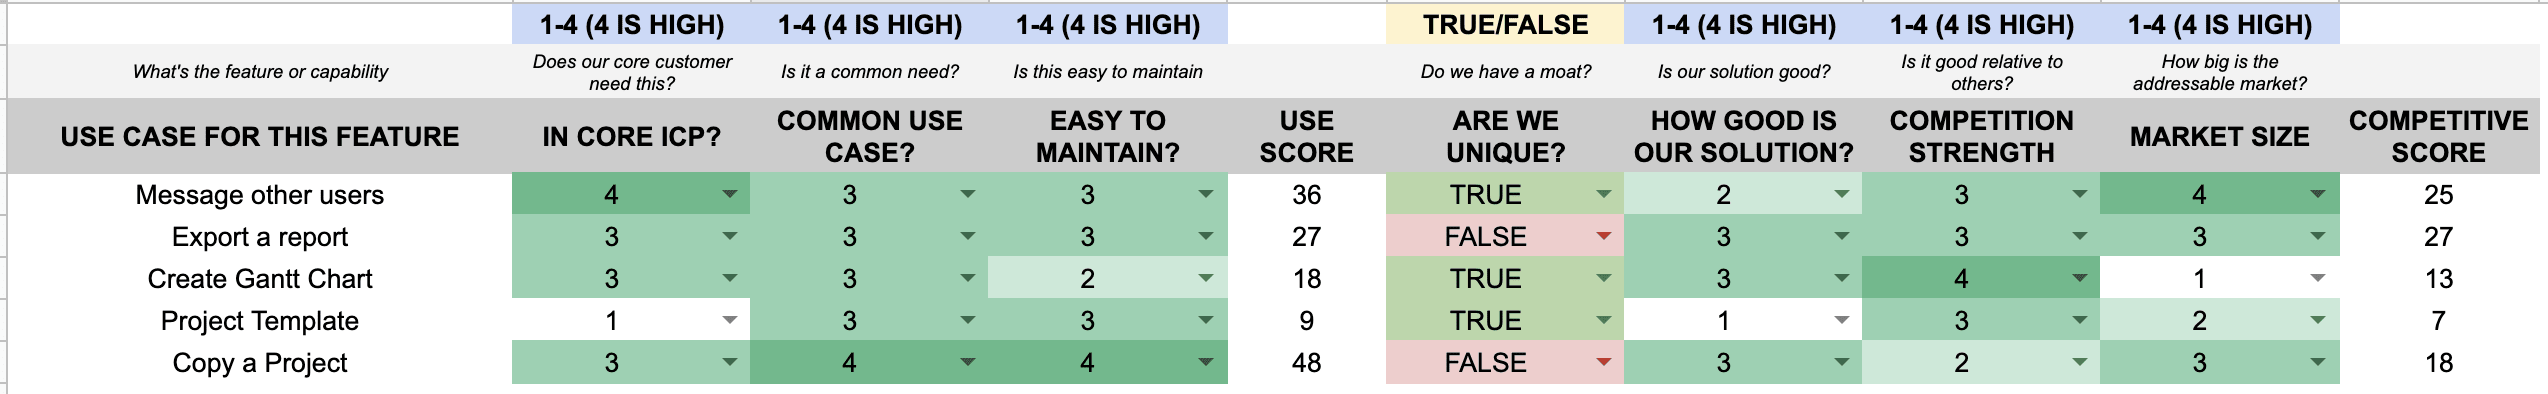
Here’s the first version of this model (feel free to make a copy if you want to try it yourself). It suggests a series of factors that you rank from 1 (low) to 4 (high) to create a “use score” and a “competitive score” for a feature. Once scored, graphing these scores gives you a scatter chart to separate the priority among features.
Broadly speaking, the USE SCORE is a way to match the most common use cases of a prospect along with indicating whether the thing that the user is trying to do fits with the overall product goals. It’s not intended to be a perfect scoring algorithm, but a rough cut to separate one idea from another.
Similarly, the COMPETITIVE SCORE aims to measure our assessment of the competitive strength of our solution. Because we overweight the value of the solution we’re selling, we plot the competitive score against the use score to determine the best match. We want our most competitive offering to match the feature the prospect values the most.
What are we trying to solve here? The goal is to create a way for:
-
multiple people to rank a set of features
-
enable these people to use factors with an agreed-upon definition
-
create a score on two axes to force a few features to outcompete others
Let’s break each one of these columns down in the context of a fictional company thinking about enhancing an existing SAAS project management tool. (Think Asana, Airtable, or Monday as example products that fit this bucket.)
Use Score – will prospects find utility?
The purpose of a USE SCORE is to estimate if the people who will use the feature will try it more than once.
We create this score by multiplying a few factors:
Factor 1: IN CORE ICP?
Is this functionality expected by our core customer profile? For a project management tool in our example, the potential feature of messaging other users is expected when you collaborate on a project. Scoring this correctly requires you to identify your core customer. If you have more than one core customer, take your best guess on whether the customer in your mind will use this feature.
Factor 2: COMMON USE CASE?
Is this idea or feature common among multiple types of users? When you start thinking beyond your core customer and think about all users of the product, is this a widely expected feature? That same collaboration feature of communicating with other users might not be as common among all users as it is among your core users.
Factor 3: EASY TO MAINTAIN?
For the average user, will it be easy to use this feature over time? Is it basically a “set it and forget it” idea or does it need constant attention? For the collaboration feature we’re thinking about, it’s easy to maintain. However, it also depends upon other users being engaged, so it may not be the easiest.
The average user overweights the benefit of the solution they have by 3x, so providing a solution the checks all of these boxes is critical to getting them to try your feature and to continue using it.
Competitive Score – how competitive is our solution?
The COMPETITIVE SCORE is focused on the strength of our offering based on the other items the prospect might choose. This is one set of factors you might use to establish your competitive strength, and is not intended to be exhaustive.
Here are the factors to establish this score:
Factor 1: ARE WE UNIQUE?
If your feature idea is unusual in the market, it may give you an advantage. But uniqueness may not be that important, so it’s difficult to factor into a score. This is one item in the model where you need to customize the value of uniqueness. Instead of multiplying this factor I simply added 1 if it’s true; if you want to add more value you could change the formula. For a prospective feature like messaging, making it unique might be tough.
Factor 2: HOW GOOD IS OUR SOLUTION?
Having a unique solution is great. But how good is that solution relative to the competition? If everyone in market has a similar feature, adding a unique twist may not offer much compounded value. Messaging other users feels like table stakes: expected by users and not necessarily differentiating.
Factor 3: MARKET SIZE
The overall reach for a feature might be smaller than you think. Or it might be quite large. Factoring the TAM (total addressable market) for a feature helps you to decide whether to invest. While you are thinking about the market size, consider whether this feature needs help from another feature to truly reach the market. For example, requiring a login to the platform might limit the reach of a messaging feature, whereas allowing anyone with an email to message adds fewer limits.
What’s missing from this model?
This model is one way to prioritize. It’s by far not the only way you could run the feature selection and evaluation process in your organization.
What this model does well:
-
establishes a data-driven standard to compare features against each other
-
can be expanded to more factors if needed
What’s missing in the model?
-
this single score doesn’t include scores from multiple stakeholders
-
this math is arbitrary and may cancel out unless more factors are considered
Whether you use a model like this or make your own, building a rubric to evaluate features with data will help separate one from the other.
What’s the takeaway? Using a prioritization model helps you demonstrate the tradeoffs we make between features. Letting multiple people score these features opens the conversation up to additional team members.