One of the fastest and best ways to start understanding a dataset is to look at it using a pivot table. Pivot tables are a feature in most spreadsheet applications that summarize data, analyze it flexibly, and group data quickly for deeper forms of analysis.
Pivoting data makes it easier to count and perform other aggregates over a dataset without much work. With pivot tables, it’s easy to answer questions like: “how many sales did we have this month” or “how has the sales data changed week over week” without changing the underlying data set.
How long have Pivot Tables been around?
Pivot tables were created by Pito Salas – an engineer at Lotus – in 1986. The feature was created to help teams answer exploratory questions about data without needing to write SQL queries or build different data structures to get simple answers.
Pivot tables were added to Microsoft Excel in 1994, so this is a pretty mature piece of technology that has been added as a default to almost every spreadsheet and BI tool at this point.
Why do pivot tables make sense to use?
If you’ve never tried pivot tables as an answer to a worksheet of data, give it a whirl. They summarize a series of data using a Row of data – typically a grouping you want to create by category – and a calculated value like SUM or AVERAGE or MEDIAN that you want to count over a series of rows that follow that condition.
Pivot tables help you get a sense of the underlying data without having to consider every column in the dataset.
Three quick ideas that use Pivot Tables
-
Time analysis – if you have a date field in your data, add another column to your dataset to calculate the day of the week, the week of the year, or the month of the date. Now add this calculated field to your pivot table and you’ll be able to show data in the same aggregate by week or weekday or month.
-
Segment the data – perhaps you have an interesting condition you want to measure, like “purchases over $500” or “MQLs from companies that have employee counts over 1000 people.” Create a calculated field in your dataset using a true/false conditional IF statement, marking that field as 1 for true or 0 for false.
Using a numeric term instead of the “TRUE” or “FALSE” value lets you both group and sum by your conditional, and also allows you to add conditions and see if rows follow multiple conditions that otherwise would be difficult to combine.
-
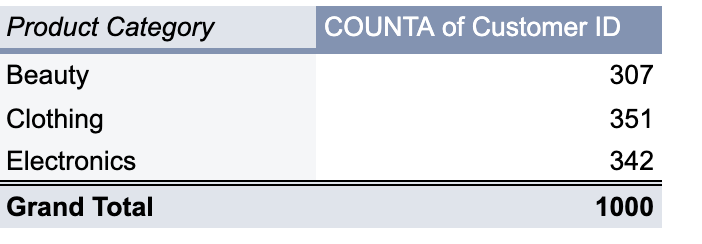
Deduplicate a set of data – one of the simplest and best uses for a pivot is to deduplicate a set of data. Select a single field in your data set as a row, and then use the same row as a COUNTA value. Sort this pivot by count descending and you’ll know if you have any duplicates if they show up with a count of 2 or more.
Advanced Pivot Table usage
Now that you’ve gotten the hang of things, here are a few more things to try as you are creating your pivot tables to make them more effective.
Use Named Ranges – instead of referring to the data in ranges like ‘MyData!A1:E1000’, you can use the Named Ranges function in Google Sheets or Excel to refer to the data in useful chunks, like mydata or if you want to search single columns in the dataset you could name a single column range.
Filter your pivot – if you don’t want to or can’t change the underlying data, you can use filters in the pivot to limit the data. A common thing you might do here is limit the set to non-null records for a field; filter for a data range or series of values; or create a calculated field in the pivot table and check for true/false value
Calculated fields – calculated fields let you compare prior periods or create percentages, like dividing the number of records that meet the current condition by the total number of records – you can also get this effect by setting a column that displays % by row or by column depending on what you are calculating.
What’s the takeaway? Pivot tables are an invaluable tool for analyzing a dataset. They let you slice and dice the data without changing the available data and give you insight into the shape of the data. With pivots, quickly understand the data that’s there and easily change your analysis depending upon new conditions.