If you have a comment or are interested in sponsoring, hit reply.

A Venn Diagram uses overlaps between sets to show commonalities between typically two or three items. Invented by philosopher and logician John Venn, this visualization technique has been around for almost two hundred years.
I’m a fan of collaborating with LLMs to build process diagrams and believe that building logical diagrams automatically will make it easier to collaborate on visual designs. Many of the useful diagrams we build and re-build when systems change would be improved with the ability to regenerate them on demand.
Also, it’s an opportunity to make funny comparisons automatically.
Let’s give it a try!
Experimenting with Venn Diagrams
Venn Diagrams are interesting because they encourage you to think visually about the intersections between things.
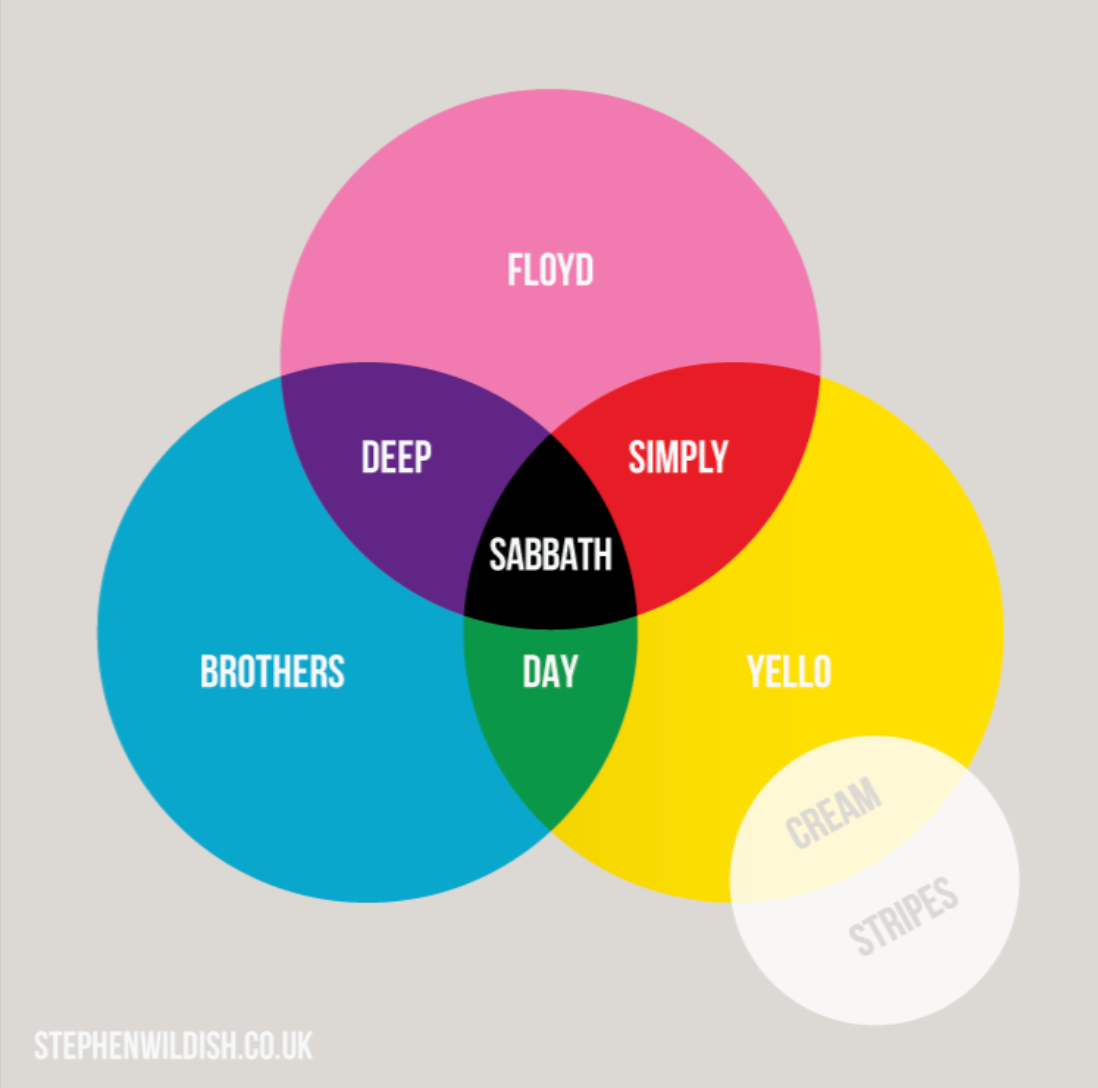
When artists get creative, they combine words and other attributes, like color, as in this example to creatively list popular bands.
Venns help you to see familiar topics in new and interesting ways. I thought it would be fun to build Venn Diagrams with ChatGPT from an initial input of
“Create a Venn diagram for [specific categories] with [unique and overlapping characteristics].”
Our goal here is to produce venn diagrams from any comparison.
Ideally, ChatGPT could tell us whether this is a “good” or a “bad” comparison eventually based on the quality of the comparison and the uniqueness of the insight. For now, we just want to prototype the ability to create these visuals from a text prompt.
ChatGPT has the capability of using matplotlib-venn – a python library to draw overlapping circles – so it can build a classic two circle or three circle overlapping venn. But what do we need to know to create an effective Venn Diagram?
Think like a product manager
An effective Venn Diagram does a few things:
-
Demonstrates a commonality between the set
-
At the intersections, produces an unexpected commonality. In popular venns like the Bands and Colors above, the blending of colors into other colors is echoed in the call outs, but the attributes don’t necessarily extend into “similar musical styles” or other common attributes.
-
Is easily understandable and has a minimum amount of text.
For our experiment, the first goal was to create a picture from the command to create a Venn Diagram between two or three things and to instruct the process to compare along a particular attribute.
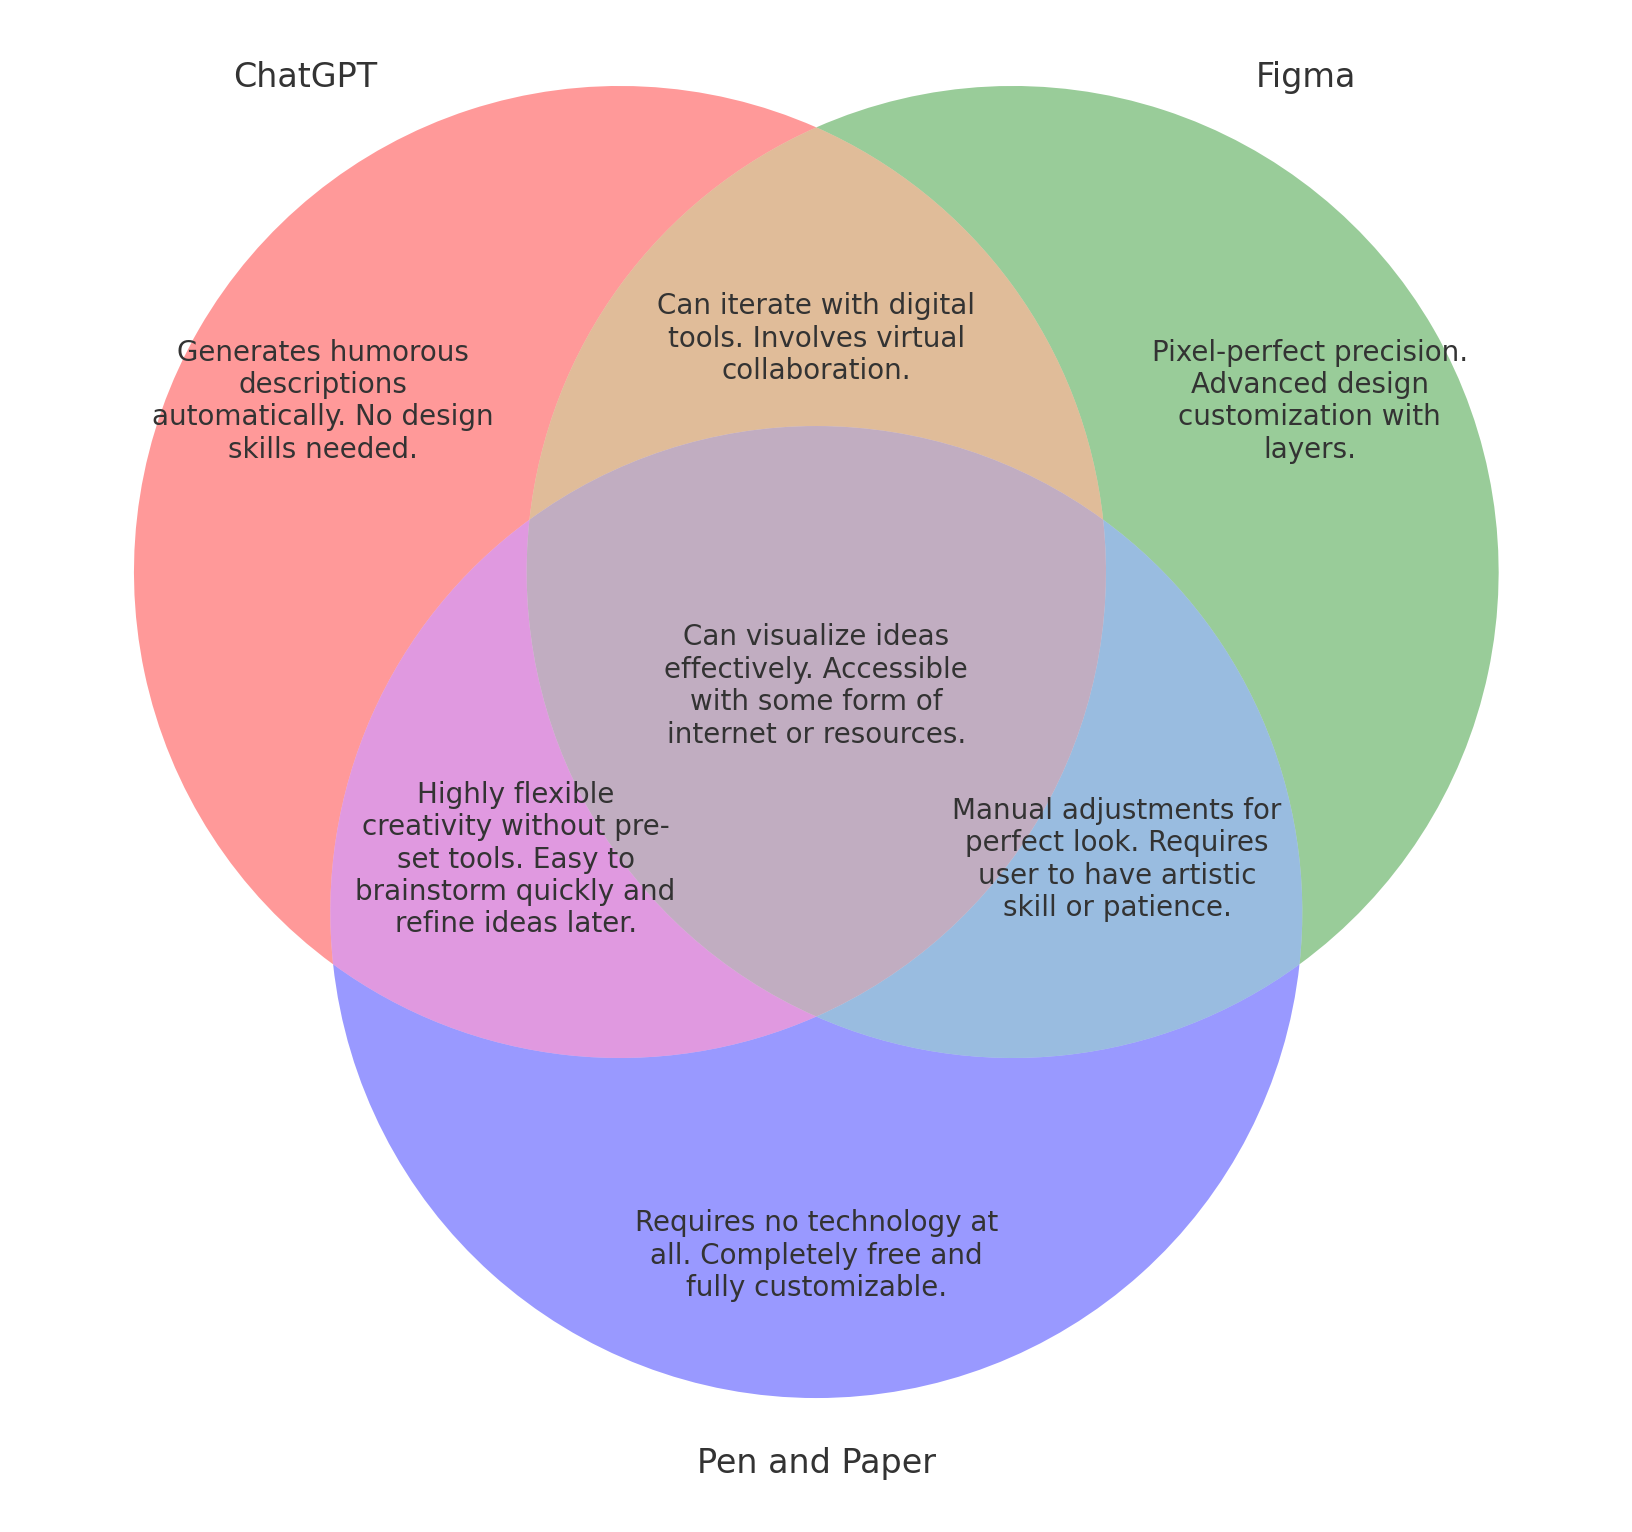
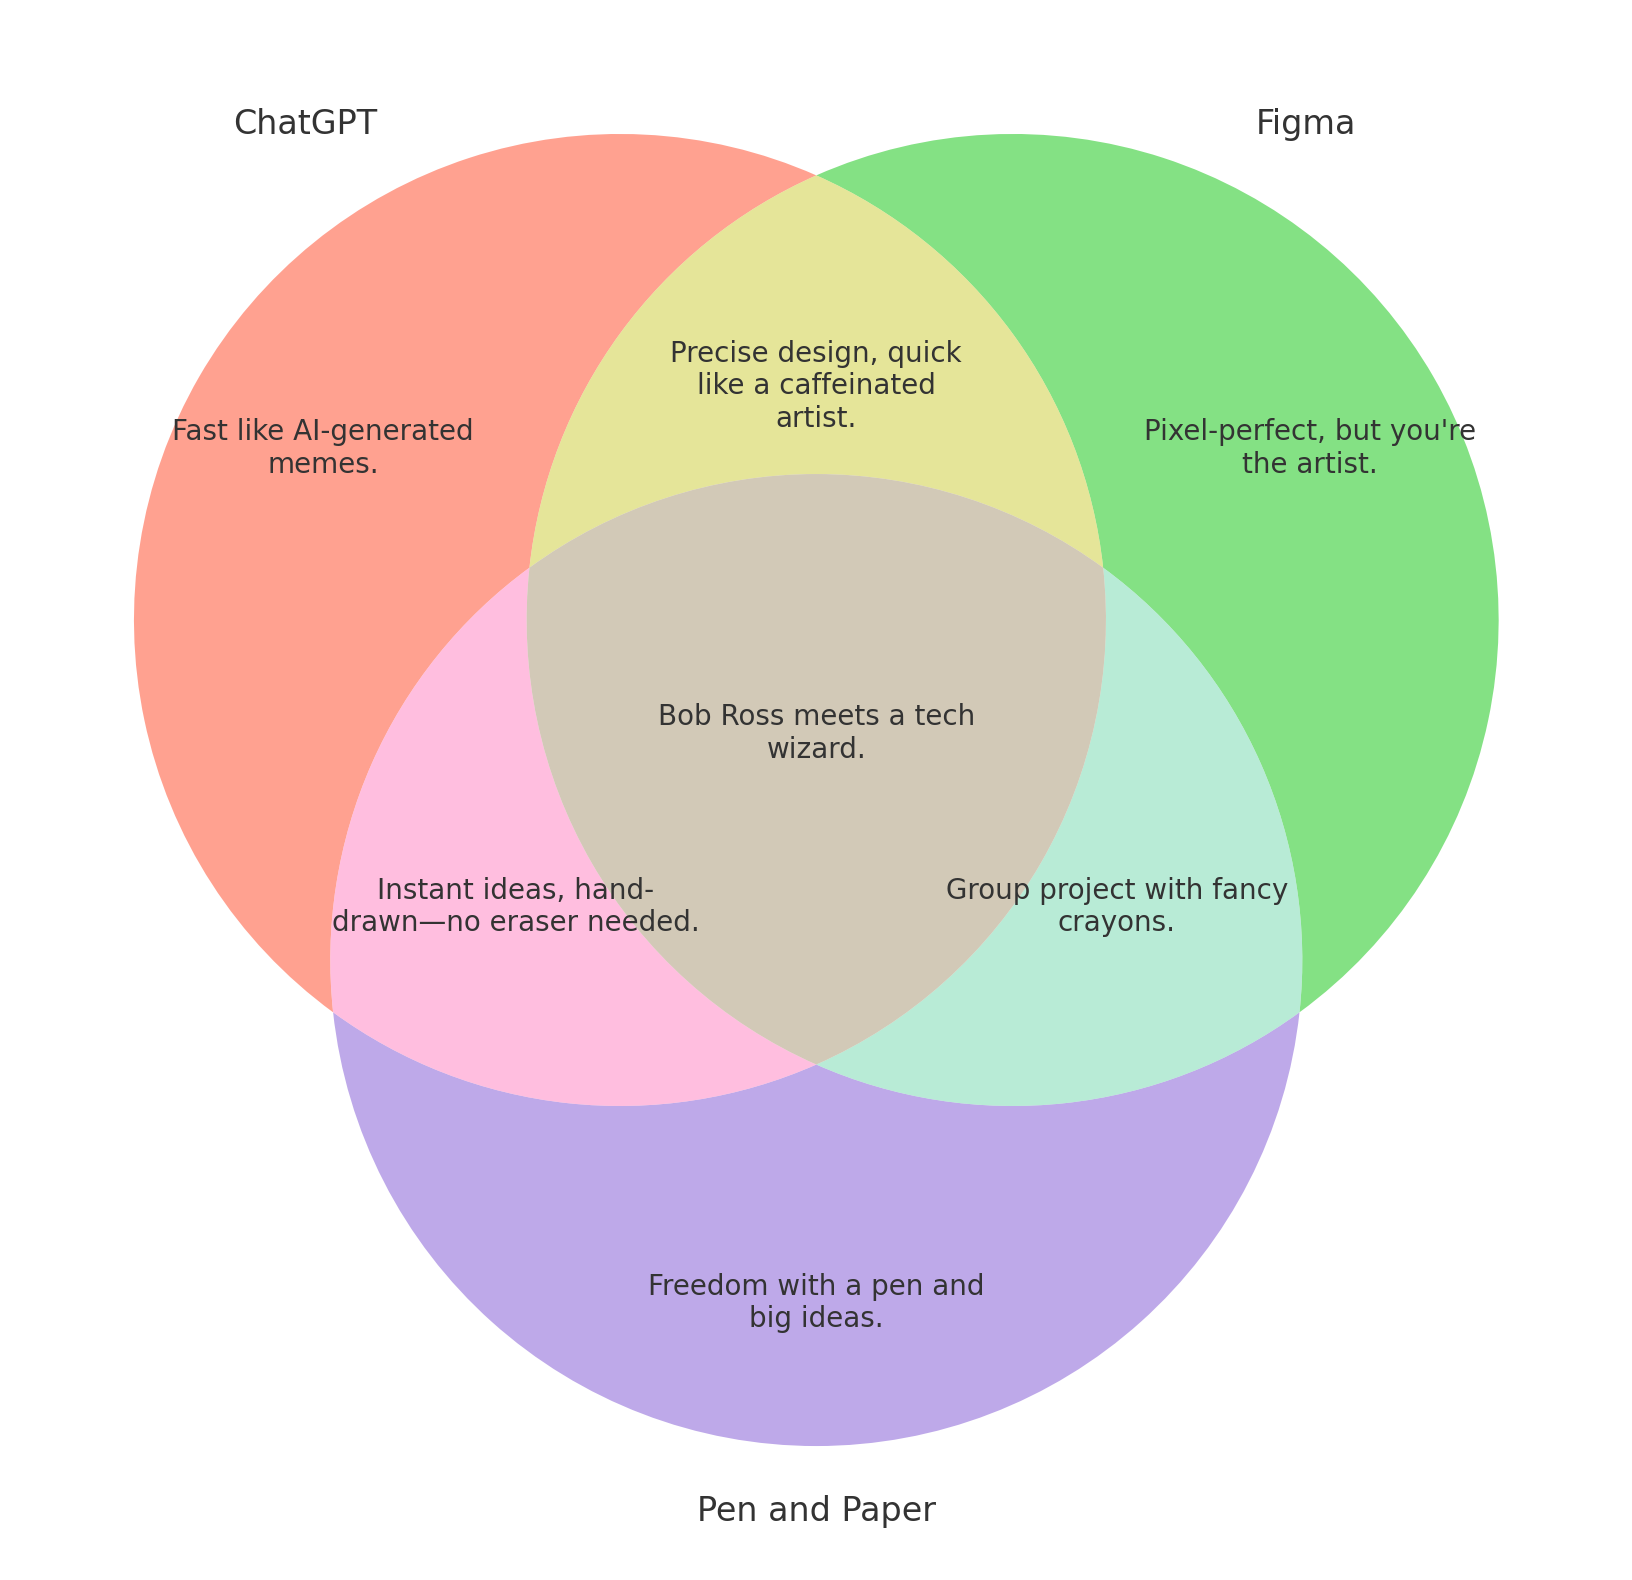
For our example, we’re comparing the set of making Venn Diagrams with three different methods:
-
with ChatGPT (our “new” method)
-
with Figma (the expected method for vector graphics)
-
with Pen and Paper (the old standby)
It’s a meta-comparison, of course, but seemed appropriate when thinking about auto-generating Venn diagrams.
I’ve built about 25 diagrams using this process, and the results are getting closer to what I imagined originally when I wanted to create a Venn Diagram generator. I got better results using one of the newer ChatGPT models: ChatGPT 4o with canvas.
To be terrific, you must be specific
The biggest learning that I had was to be quite declarative and constrain the outcomes for the output that was created:
-
When the text output was too long, telling ChatGPT to “make it shorter” wasn’t sufficient – I needed to tell it about how to shorten it (wrap text and draw within the available area) and also how to improve the tone
-
When it wasn’t able to define set intersections, it helped to tell the prompt which attributes to use to compare the items
-
Sometimes the text comparisons were a bit … weird
If you think about the way LLMs assemble tokens into text, it’s not surprising that the generated text is sometimes bland. It’s basically the median tone for all of the nearby text about a thing that has been ingested into the model. To adjust this, it helps to define a writing style that you want to emulate in the output.
To do this, borrow the format from Crew.ai’s agent ai descriptions, that specify a role, a goal, and a backstory for an agent. You might prompt the LLM: “You are a social media strategist. You are excellent at crafting compelling and humorous visual representations of ideas. You started as a consultant and worked briefly as a mildly populat stand-up comic for popular clubs in NY and LA.”
When you apply this filter, you get better text, as in the below result.
The LLM Prompt for you to try
Here’s the prompt that ChatGPT stored from our interactions
Prompt:
“Create a Venn diagram for [specific categories] with [unique and overlapping characteristics].”
Key Preferences for Venn Diagrams:
-
Use shorter, humorous descriptions for each unique and overlapping area to ensure readability.
-
Apply text wrapping so that descriptions fit well within their respective areas.
-
Each description should be concise and fit comfortably within the Venn diagram sections.
-
Avoid prefixes in descriptions (e.g., instead of “Superheroes Only: Saving the day with capes and superpowers,” just “Saving the day with capes and superpowers”).
If meaningful intersections cannot be determined, prompt the user for suggestions:
-
Provide a list of unique attributes for each category and ask the user to identify any that could be shared to create appropriate overlaps.
-
Ask for feedback on potential shared attributes, allowing the user to control which attributes should be represented as intersections.
Parameter Suggestions:
-
[specific categories]: For example, “Introverts, Extroverts, and Ambiverts” or “Cats, Dogs, Humans”.
-
[unique and overlapping characteristics]: E.g., for “Cats, Dogs, Humans”:
-
Unique characteristics: “Loves yarn” (Cats), “Fetches stick” (Dogs), “Pays taxes” (Humans).
-
Overlapping characteristics: “Needs affection” (shared by all three).
-
Ready for Prime Time?
LLMs have come a long way in their ability to evaluate complex reasoning like what you see in a Venn Diagram. With the right prompting, I do think they are getting to the point where you can automatically build simple diagrams. It remains to be seen how much drift you would likely see when giving it oddball comparisons, so testing is needed.
They are on the path to becoming quite useful in almost any visual comparison. Cool!
What’s the takeaway? LLMs are not yet ready to build Venn Diagrams in a one-shot prompt without refinement, and are getting much closer to building automated process diagrams. Using an agentic AI strategy is a very promising way to constrain the output in expected ways.