One of the most challenging things thinking about scale in a 0-1m company (or a 1-10m, or a 10-100m) is the difference between where you are right now and the place you’d like to be in a month, a quarter, or a year.
Scale implies thinking about your organization as a much larger one. Said another way, it means expanding revenue (and eventually, profitability) without a corresponding linear increase in resources.
To find scale, you need to remove inefficiencies from your existing processes and also uncover new opportunities that happen as you gain a larger customer base or additional transactions that open new markets.
Breaking it down to goals
Michael Drogalis is a software developer building a 0-1 product.
I don’t think anyone needs [sic] convincing that goals are important, but what I’ve found is that you need three kinds of goals to pull you forward:
Long-term goals: write down exactly what you want to have achieved 3+ months from now
Weekly goals: like it sounds
Daily goals: ditto
The key is to connect all three with one another.
I like the way that Michael describes the problem simply: make some goals, track activity, and make the goals attainable on a daily, weekly, and longer timeline.
This is not rocket science, but a reminder that the basic tools to scaling are activity markers that happen much more frequently than an epiphany where you proclaim “aha! We’ve reached scale.”
It’s much more likely that you look back at the slope of the achievement and remark: “we’ve come a long way since that last milestone.”
The fuel for that goal? Sustained work, achieved continuously.
Finding signal in the activity
How do you build revops for scale when you haven’t reached scale … yet?
It comes down to a repeatable process of examining activity to (eventually) find a signal in the noise of the information.
-
Find an important output signal – this could be deals that proceed to a late stage, it could be wins, or it could be sales-qualified leads. Important in this context means that if you counted these things, the rest of the business would have a clue about what you’re counting. Keep it simple.
-
Break that signal down into tactical steps – imagine that you are walking along with the data through the process and have landed exactly one step before the important thing you want to happen. What do you know, and what’s the next step that data needs to take to move forward (example: become closed-won)
-
Zoom out to find a pattern – we all like to find patterns in data. I’m not suggesting you build a complicated Rube Goldberg machine to predict next actions. Starting by counting from an earlier point is a good next step, so that you see any obvious clusters in your data.
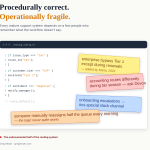
Say you are in a typical enterprise sales process for selling software and you want to bend the curve of revenue. Instead of having 50-60% of your revenue in the last month (or the last week!) of the quarter, you’d like to make your revenue more linear.
You would want to do something like the following:
-
Measure the median age of the closed opportunities in the pipeline. For many enterprise sales cycles, these might span multiple quarters, giving you a median age of 90-120 days or even longer. (How many deals close in-quarter vs spanning a quarter?)
-
Look at the median days in stage for your existing opportunities, comparing the deals that went closed won vs your closed lost opportunities (Which stage and age are the most likely places for deals to stall?)
-
For the deals that end up lost, are there any commonalities or items to spot (Skipped meetings, lack of activity, low response rate are common items)
In a perfect world, each rep could look at their pipeline and decide based both on intuition and on data if a deal is likely to close or not.
We’re not talking about auto-disqualification of a deal – we’re implying here that giving reps decision support for the parts of their pipeline that are more likely and less likely to close will help them adjust their activity to higher-value targets.
Turning activity into tactics
What could you do to speed up the pipeline in this example?
Here are a few ideas:
-
Segment the pipeline – in each month of the quarter, consider early, middle, and late pipeline, not just the best deals most likely to close.
-
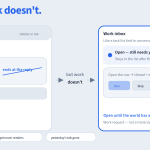
Work deals more often – in weekly metrics, devote activity to each segment of the pipeline to move those opportunities to an earlier closed state. While it’s disappointing to get a closed-lost opportunity, it’s better to work an opportunity to close than let it linger.
-
Get more wins earlier in the period – for teams on quarterly periods, success looks like making the monthly revenue more linear. For teams on monthly periods, the same is true but on a weekly cadence.
Tracking a pipeline this way is by no means a panacea. It doesn’t guarantee success. But it does make it a lot easier to recognize much earlier when you have a problem and to double down when you are achieving success.
What’s the takeaway? If you zoom in, growth happens a little bit at a time. It looks like it happens in giant chunks and it’s a series of stair-step improvements that get locked in via improved process and relentless focus on activity.