
When you’re looking at data to inform a RevOps question (or any question), one of the key calculations you typically do is compare the average of a set of data to its median.
Why do this? You want to understand the shape of the dataset and assess whether individual values in the data are throwing off the average.
The median is exactly what you’re looking for – the point in the data where half are above and half are below – and it’s a great way to assess change over time in a series of data. When the median moves up, you know that the average value is going up, and vice-versa.
Great! You go to get the median for your dataset in Google Sheets and it’s really easy. Select a row or column of data and you get this handy explorer in the bottom right-hand corner of the screen.
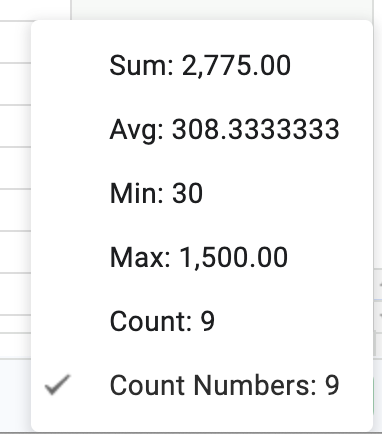
Oh, it doesn’t include MEDIAN. No worries, you quickly look up the function and discover you need to include a range of cells and wrap with the function, e.g. =MEDIAN(A2:A11).
But what if you are finding the median value for a set of rows based on the condition of other fields, like “find the median value for sales amount based on sales from last week”, or “find the median time to response from the customer inquiry to the sales activity”?
When you look for conditional formulas to measure the median you will find SUMIFS and AVERAGEIFS, but not a MEDIANIFS function.
Running formulas over a range in Google Sheets
Google Sheets makes it easy to reference a range of rows and columns by using the typical notation, e.g. for the columns A to E and the rows 1 to 100, you would create a range called “A1:E100”. This notation delivers an array of all of these cells for you to use in formulas, but does not limit the cells according to a conditional statement.
FILTER almost gets you there
FILTER is a Google Sheets function that returns either filtered rows or filtered columns according to the criteria you specify. That means that if you have a dataset with 10 columns, you’re going to get a 10-column result.
Displaying the results in a single column is possible, but messy. If you’re trying to get the MEDIAN for a single column in that result, it’s going to create some extra work and will need to be hidden on a helper tag.
QUERY is the answer
There’s a better way to filter a range in Google Sheets in a SQL-like way. It’s QUERY, a function that lets you filter data from a range using arbitrary conditions to span columns and rows.
QUERY specifies a range and a query statement to run against that range. For example, you might query a range to find rows that fall into a date range, or for which columns equal a specific value.
This is really useful for making a MEDIAN calculation on a single value in a set of rows defined by multiple conditions.
A simple example, using a sales dataset
I used a 1000 row dataset of retail sales information to demonstrate using these techniques on actual data. If you’d like to follow along or make your own copy, find it here.
To make the MEDIAN and QUERY formulas easier to read, I created a named range of “all_sales” that covers the entire dataset from col A to I.
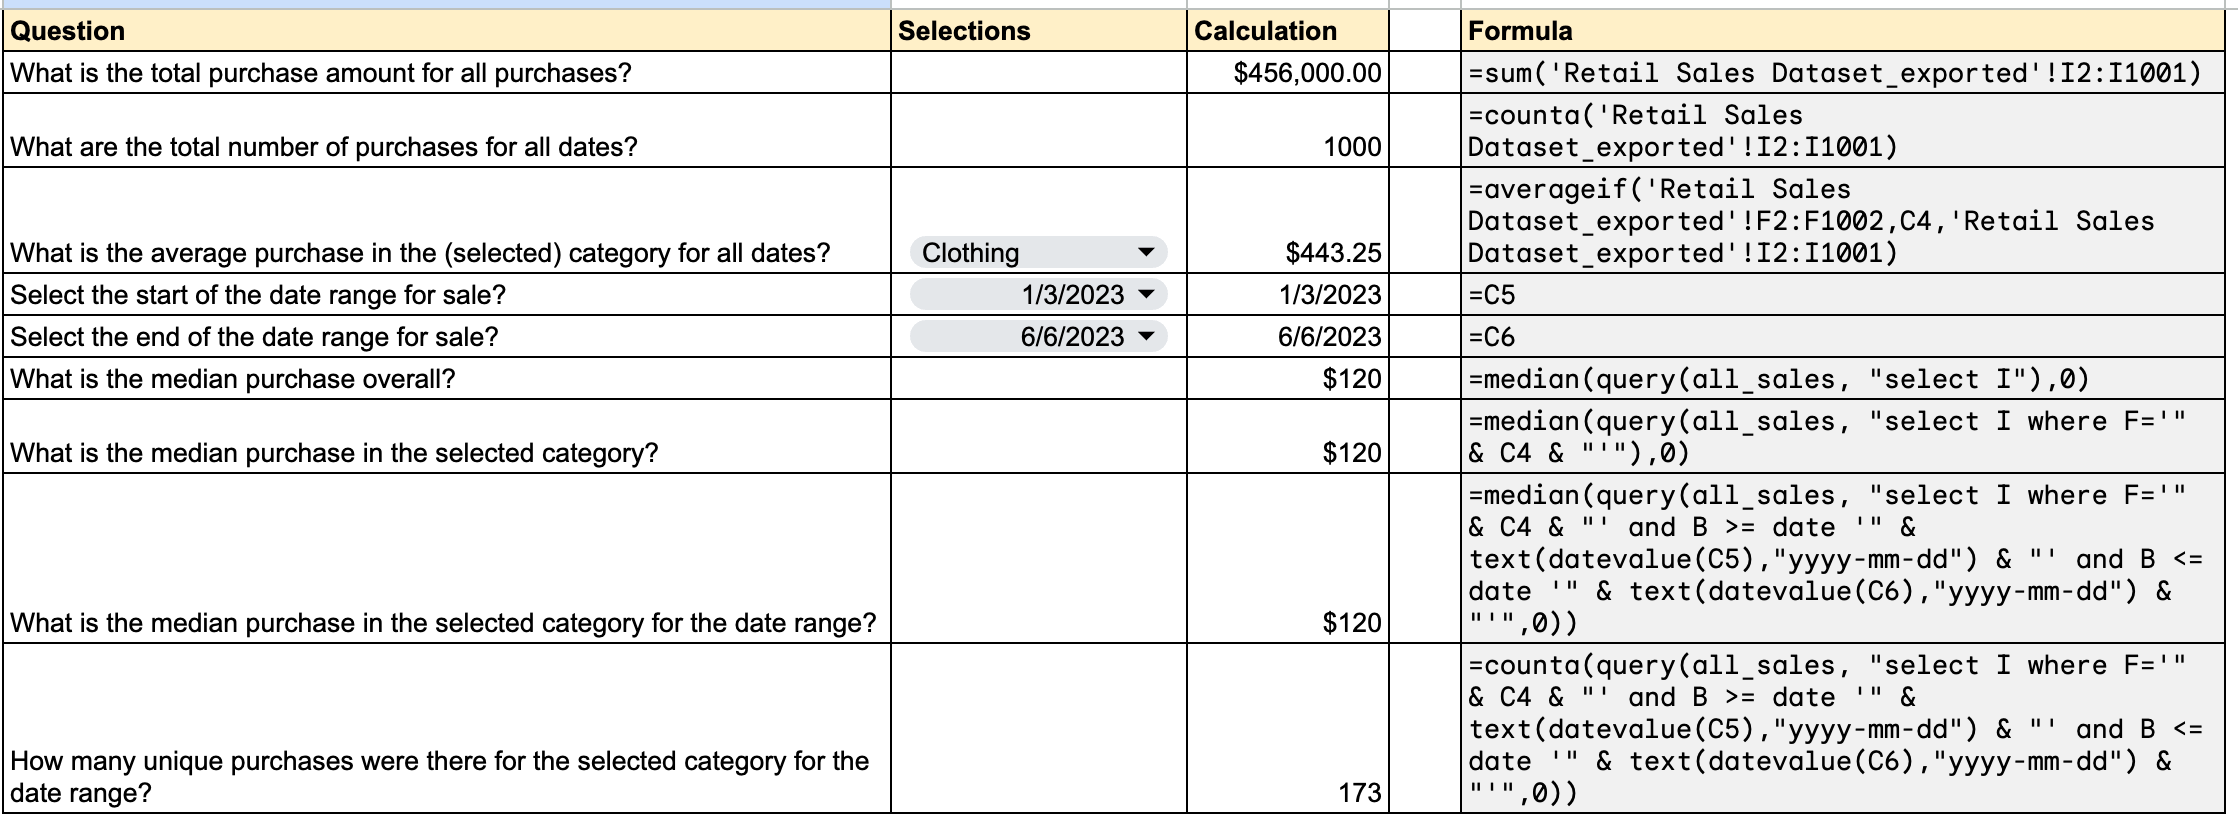
The figures above (you can see them in the sheet here) highlight the difference between the simple calculations you might make to SUM, COUNT, or AVERAGEIF a column of data and the additional step you need to take to create a MEDIAN across a set of data spanning columns.
If you want to create a median for a single column of data, you use MEDIAN to wrap the range. But if your range contains multiple columns you need to use a clever method to get a single value – QUERY makes that possible.
=MEDIAN(QUERY(all_sales, "select I"),0)
Says: “take the median of all of the series of values returned in Column I”, or $120.
=MEDIAN(QUERY(all_sales, "select I where B > date '2023-01-01' and B < date '2023-02-28'"),0)
Takes the same data set and filters for a date between 1/1/2023 and 2/28/2023 and then takes the median of that series, or $150 in our dataset.
Check out the spreadsheet for a few more questions that demonstrate using additional fields to alter the query and create conditional answers. When you need to find the median of a dataset, you’ve now got new tools in Google Sheets.
What’s the takeaway? Google Sheets makes it easy to create conditional sums and averages on a range of data. But calculating the median for the same data set takes a few more steps. Using the QUERY function lets us create conditional logic to isolate the fields we want to use to calculate the median.