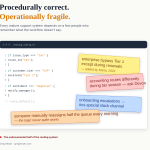
Choosing Software is … complicated
In a perfect world, selecting your next software tool to solve a problem is easy! Your need is well-defined, you know all of the participants in the space, and your job to be done overlaps neatly with the scope and capabilities of the product. Oh yeah … and it’s within budget and will scale with you for the future.
The reality is a bit more complicated. Even in the best-case scenario, you’re taking an educated guess to match product capabilities with ease of use, adoption potential, and the future needs of your business. You might know what worked for you in a previous role and tool (and vendors might recognize you as a past champion), and even that knowledge is not a slam dunk for product selection and success.
Another key issue is that new companies have entered the chat. Even if your evaluation is 12-18 months old, there are new contenders, and incumbents have introduced new products or features.
No problem, you say. I’ll look at a market map to understand what’s out there! This is a classic tool to summarize the competitive landscape and learn more about a category.
What is a Market Map?
A market map is a visual tool that helps us understand where different solutions sit in their relationship and to buyers.
Remember those Venn diagrams from school? Two or three overlapping circles showing what’s unique to each set and what they share in common. They’re elegantly simple, but as our need to understand complex market relationships grew, we needed something more sophisticated.
That’s where market maps come in. While Venn diagrams show overlaps, market maps help us understand positioning. They take the basic concept of comparing sets and add dimensions that matter for decision-making. Instead of just showing what’s shared, they help us understand why things are different and how they relate to each other in a competitive landscape.
Forrester Wave, Gartner Quadrant, G2 Grid … These are all shorthand ideas to move more companies into the consideration set. You could argue that they are simply good marketing and shouldn’t be the only thing to consider. But you’re going to look at it anyway.
While market maps are great for high-level analysis, they often miss the nuances that matter most when buying software.
Let’s talk about how to bridge that gap.
The Gap Between Maps and Reality
In 2021, I needed to lead an evaluation of contact enrichment tools for software buyers to learn more about their potential to buy database software.
One of the key evaluation features was the ability to match the persona (title) with seniority (something that varies with title from company to company) and estimate the number of target personas present in the contact enrichment software for specific accounts in a wide geographic spread.
One of the key learnings was a large difference in the contact match rate by the contact’s country when we evaluated the leading data enrichment companies in a data “bake-off”.
Some of the providers delivered relevant contact enrichment in North America, while others were much better in other geographic regions like Europe and Asia Pacific. Yet their websites and sales teams insisted that the coverage was great regardless of the location they were searching.
The point here is that none of the marketing or the website copy would tell you about these relevant strengths and weaknesses. This is exactly why we need better ways to evaluate tools.
Standard market maps and vendor materials often miss critical details that only emerge through real-world testing.
Using AI to Enhance Market Mapping
Let’s say you want to subscribe to a CRM and you don’t know whether to pick a market leader or a proven choice. You’re going to be making tradeoffs – but you don’t know which ones – so you need background information.
There is a constellation of questions in mind, including user adoption, pricing, interoperability, and value. A CRM’s core promise is to keep track of your data and make it easier to use in the context of your business.
And you’ve got other business needs to meet. Which product provides context to the operator, is pleasant to use, facilitates modern workflows and UI, and won’t lock you into a long-term contract? Does the software get the job done by keeping track of your data while providing context for past events and make it easy to orchestrate workflows?
That’s a lot to fit in a market map idea.
I’ve been using ChatGPT to help create more granular market maps that answer specific questions that a team might have during the procurement process that aren’t answered by Gartner or Forrester or G2.
I use chatbots to generate ideas and refine my thinking on other topics, so why not market maps and procurement? That way, it can also incorporate writings from smart peeps like because he’s publishing his thoughts online.
Here’s a prompt that’s worked well for me:
🟢 FUNCTION PROMPT — "MarketMap"

Create a quadrant market map for  that answers:
• Should I buy this software?
• Will my users adopt it quickly?
• Is it forward-looking enough to scale my business?
• Does it work with AI today?
• Will I regret the choice in 12 months?

Inputs (ask me if missing):

1. Vendors (comma list, or suggest up to 10 if blank).
2. Time horizon for public data (default: last 12 months).
3. X-axis metric — pick or suggest (default: **Time-to-Value**).
4. Y-axis metric — pick or suggest (default: **AI Maturity** = # live AI features).
5. Bubble metric (optional, default **Cost per user/month**).

Process (hidden from end user):

• Collect/verifiy public data for each vendor.
• Normalise each metric 0-100 (explain formula briefly).
• Plot 2 × 2 quadrant with bubble size.
• Label each point; mid-lines fixed at 50/50.
• Return: chart + 150-word exec summary + strength/weakness table focused on the five questions + 3–5 move recommendations for laggards + clickable bibliography.
• Add confidence note & caveats.

END FUNCTION
You use it this way:
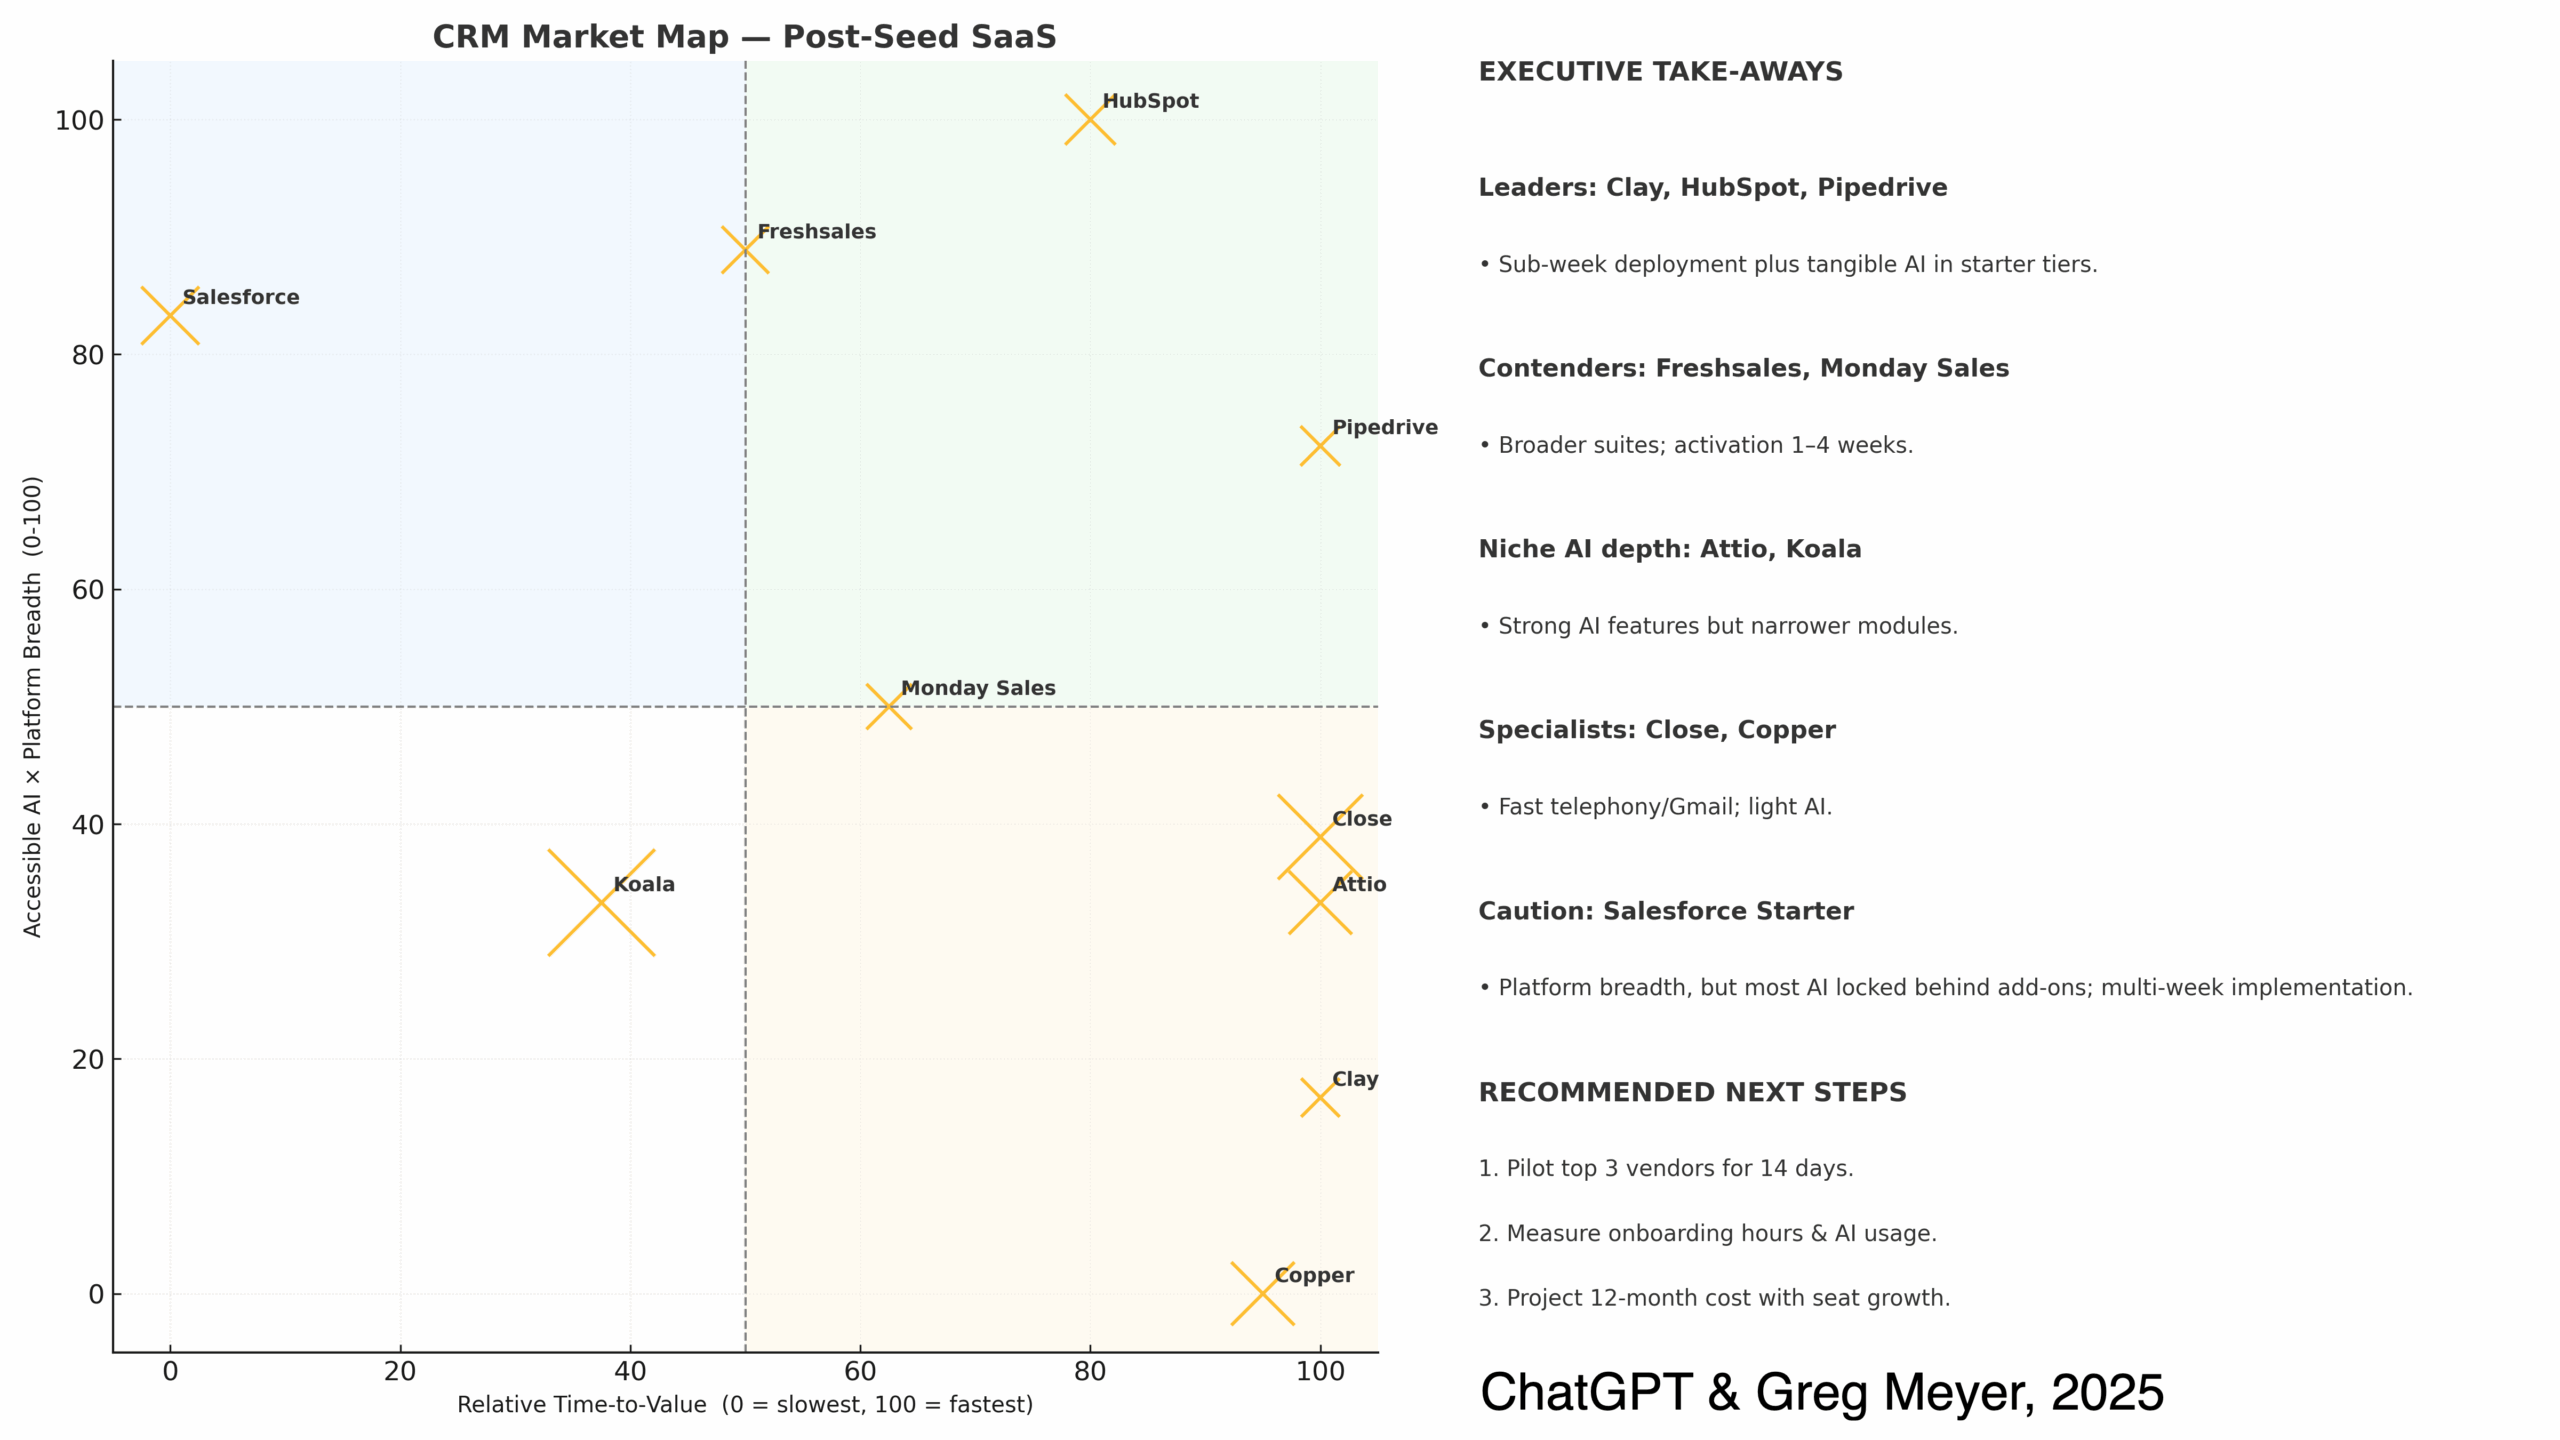
MarketMap: “CRM for post-seed SaaS startups”
ChatGPT (or your model of choice) starts an iterative series of questions, covering the companies you’d like to include, any specific ones to ignore or add, and then it does its thing. (In this case, building a plan to create the market map of information that mapped to your query.)
It’s not going to get everything right
Let’s state the obvious. An LLM is not going to do the level of research you expect from Gartner or Forrester (yet). But it is going to assemble a template of information from a wide variety of sources and enable you to start having a conversation that’s surprisingly relevant about a buying decision that you’d like to make.
When it produces the first level list as a 2×2 box graph representing the vendors you care about graphed on different axes, you can tell it: “I don’t believe that analysis – re do it taking into account that larger companies spend more money on marketing and you’re overweighting that factor.”
For example, when evaluating CRM tools, the AI might initially rank a well-marketed enterprise solution highly based on public data. But by asking it to reconsider the weighting of marketing spend and focus more on actual user adoption rates, you might discover that a smaller, less-marketed tool actually has better real-world performance metrics.
The outputs of this sort of exploration look like a ranked list of products along with the updates from your analysis. The new planning models give you some insights overlaid with search data.
In the case of CRM, you might think about combining a leader like Hubspot with an up-and-coming data pipeline tool like Clay. (Or Attio + Clay if you want to stay away from incumbents.) Clay alone doesn’t get you all of the bells and whistles of CRM, but can fill in the gaps for orchestration and AI tooling that platform tools like Salesforce are slower to adopt.
Beyond the Market Map
While market maps are a great starting point, they’re just the beginning of a thorough evaluation.
Here’s what you need to do next:
- Dig Deeper into the Data
- Talk to actual users
- Test the tools yourself
- Consider your specific use case
- Evaluate the Intangibles
- Quality of documentation
- Responsiveness of support and complexity of implementation
- Vendor stability
- Consider the Long Term
- Total cost of ownership
- Maintenance requirements
- Integration needs
Ready for Prime Time?
This is just a tool. Please, please, please use evaluation like this as part of a broader process when you’re selecting a tool. Start with the market maps to understand the landscape, use AI to help gather and analyze data, and always validate your findings through real-world testing and user feedback.
That’s how you’ll find the tools that truly fit your needs, not just the ones that look good on paper (or have the biggest marketing budget).
What’s the takeaway? Market maps are powerful tools for understanding complex relationships and making informed decisions. But remember: they’re a starting point, not the final answer. The best market maps don’t just show where things are – they help you understand why they’re there and what to do about it. They turn complex relationships into clear insights and help you make better decisions about tools, vendors, and strategies.