gregmeyer

gregmeyer

Don’t be April Fooled by AI

I’d be remiss on April 1st for not thinking about the head-fakes we all create for each other (mostly for fun). Today, some of these distractions will be created by ChatGPT or other AI tools, and many will be quite…

Data without structure looks like noise

“These numbers look wrong. Can you take a look?” When you read these words as an ops practitioner, your brain is already swinging into motion with questions: have we seen this pattern before? what exactly is happening? is this still…

A technique to build novel data sets

When I was building campaigns for OutboundWorks – a company that tried to elevate average SDR behavior to elite levels – one tactic we tried was to automate prospecting steps into groups of steps. We used one set of criteria…

Adding time travel to your GTM analysis

A key problem in every GTM organization is understanding: “what’s happening right now?” Once the team gets that answer, they want to know what will happen next. The best information you have to answer that question is to look at…

Estimate your pipeline with Google Sheets

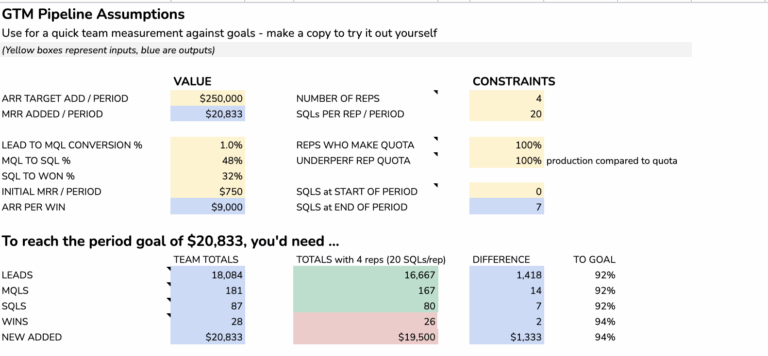
It’s the beginning of the month, and the same conversation happens at the beginning of every month, quarter, or year: “how’s the pipeline?” Pipeline is a tricky thing. I’ve heard it described persuasively as a bathtub where the level of…

3 Quick Ways to use Pivot Tables

Photo by Edgar Chaparro on Unsplash One of the fastest and best ways to start understanding a dataset is to look at it using a pivot table. Pivot tables are a feature in most spreadsheet applications that summarize data, analyze…